
Sunshine Corner 7/2026
One-Year Post-Liberation Day: A Look at Metropolitan Area Impacts

This month, Sunshine Corner is a joint research study between SRR Consulting and Southard Analysis and Research. It was a joy to work with a colleague on this project, the results of which surprised us both.
Key Findings
One year of post-Liberation Day employment by metropolitan area allows us to review impacts of this policy, in combination with other events, on total employment growth in and across these areas.
Across all metro areas, we find median job growth to be weak with the lowest standard deviation in the employment series dating back to 1991.
The range of growth across large metros in 2026 has become so narrow that no market is seeing growth comparable to last year or their past periods of strength.
Job growth is the most important driver of real estate demand. A weak U.S. employment expansion with little variation across metropolitan areas limits property income growth and the ability to add value through market selection.

Introduction
The June release of Metropolitan Area Employment and Unemployment for April 2026 provides the first full year of employment information after Liberation Day. The tariffs, defined as reciprocal, were a marked reversal of decades of declining trade barriers, or globalization. Since April 2025 announcement, tariffs have increased costs and uncertainty on final rates by country and product have affected product sourcing and logistics decisions.
The Supreme Court struck down the basis for reciprocal tariffs in February 2026, leaving them in place for much of the April 2025 to April 2026 period we examine for metro area employment. However, a higher tariff regime remains in place via other executive branch powers with rates by product and country continuing to fluctuate.
Policies, market forces, and demographics predict difficulty to return to employment growth rates that have driven real estate demand in past cycles.
Trade policy, however, is not the only major policy change impactful to the U.S. economy over the past year. Immigration restrictions and mass deportations have curbed population growth and reduced labor supply.
Large scale government layoffs via DOGE reductions in force also occurred during this period. Beyond the direct impact on employment from these layoffs, federal government spending and program cuts are reducing jobs related to scientific research, education, and cultural/diversity initiatives.
These policy shifts are playing out while increased adoption of artificial intelligence (AI) among the business community changes the demand for labor. The AI impact on labor is multifaceted, including new skill requirements and reduction of prior roles.
Additionally, the aging workforce may also inhibit labor force growth. Immigration boosted the population of Gen-X, Millennials, and Gen-Z, but policy is likely to prevent such a boost for the youngest generation, known as Generation Alpha. This smaller group is shrinking expectations for the count of high school graduates and student housing demand. Taken together, these policies, market forces, and demographics predict difficulty to return to employment growth rates that have driven real estate demand in past cycles.
Each of these dynamic changes impacted the U.S. labor market over the past year, leading to low-hire/low-fire market conditions. Separating the effects of each factor within and across 425 metro areas will require further research. With this newly available data, we focus our study on total metro-level employment to learn how job growth over the year ending in April 2026 compares to the year before Liberation Day and other key periods of U.S. economic expansion.
Looking at the Data
Total employment by metro area was pulled for all years available. Each year examined measures total metro area employment growth from April to April. A set of 424 metros were observed from April 1991 through April 1999, with the addition of Walla Walla, WA in 2000, for 425 metros from 2000 through 2026.
To expand the historical comparison beyond one year, we selected three additional years to focus our analysis on for their unique economic growth drivers. We compared the Dot-Com era in 1997, late Housing Boom in 2007, and the Smart Creative Innovation Economy in 2015. These years were chosen because, like 2026, they marked the sixth year after the last recession.
Across all metro areas, we find median job growth to be weak, at -0.1 percent, ranging from negative 4.7 percent to positive 4.1 percent. The largest growth figure occurred in a small market, Barnstable Town, MA, while the largest decline occurred in Washington DC. Notably, the standard deviation of job growth across these 425 markets was the lowest in series dating back to 1991.
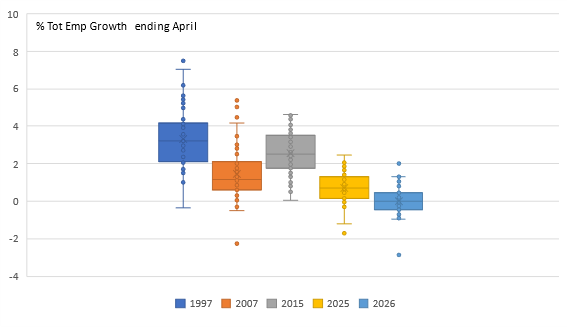
We reduced the metros to the top 55 commercial real estate markets for further study. The most prominent feature of this data set remains the low standard deviation. Figure 1 shows that compared to this point six years after recession end, even the top end of the metropolitan area distribution shows little strength. Traditionally, metro job growth is dispersed enough to find strength somewhere, even in periods of slow growth or recession.
Figure 1: Metropolitan Employment Growth Slower and Less Disperse
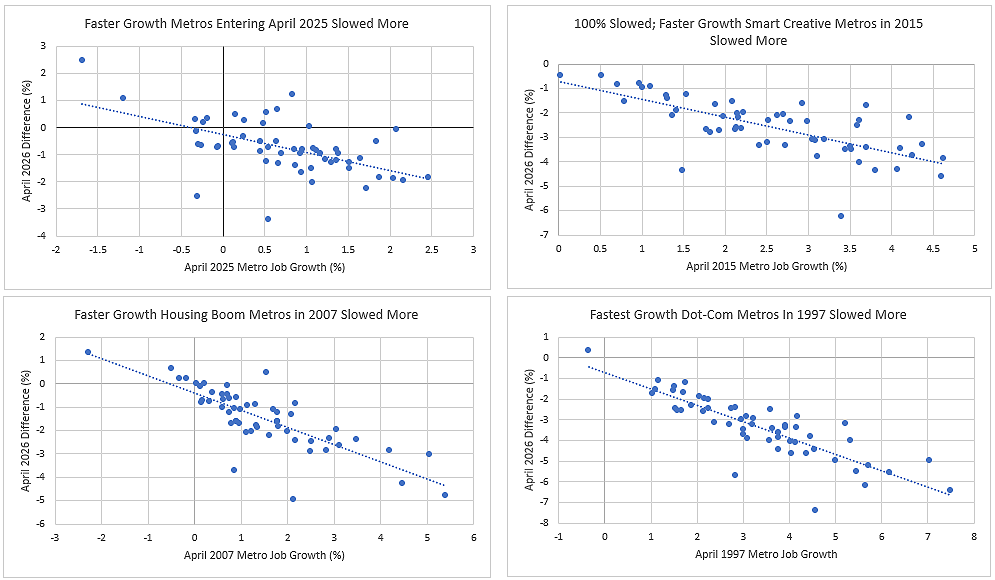
A second surprising aspect of 2026 is that we cannot look to markets that showed strength in this phase of the cycle in the past. As Figure 2 shows, no matter which period is chosen, the trendline through the scatterplots show that the strongest markets in the past have the widest gaps relative to 2026 growth.
This is particularly surprising considering the varying characteristics of the different drivers of economic expansion in the years compared. Markets exhibiting strength in the Dot-Com era, Housing Boom, Innovation Economy, or the prior year, are experiencing the most deceleration in 2026. The range of growth across markets in 2026 has become so narrow that no market is seeing growth comparable to their past periods of strength.
Figure 2: No Matter When, Leading Markets in Prior Periods Decelerated the Most in 2026
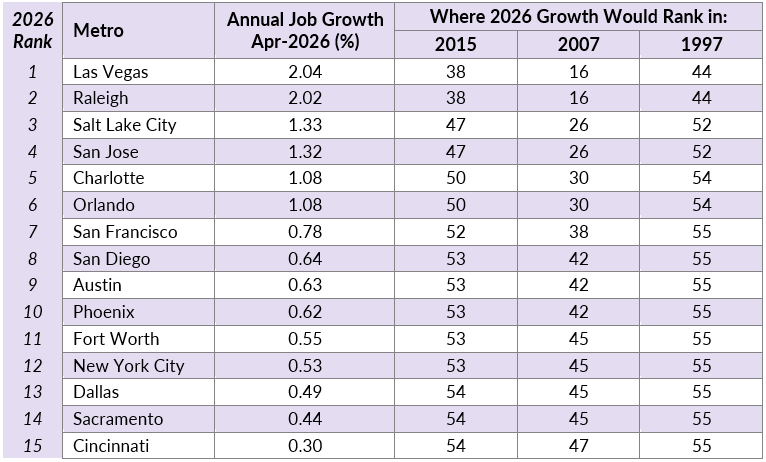
We can look at this a different way and see how today’s top 15 markets compare to prior periods. The table below lists the fastest growing markets for total employment growth from April 2025 to April 2026. The remaining columns show where these growth rates would rank out of 55 large markets in these past periods, which were chosen to reflect similar points in past expansions.
The best performing markets in 2026 look quite modest compared to job growth across all markets, particularly in 2015 and 1997. It is also striking that growth rates for today’s top 15 job markets would not rank in the top 15 for any of the comparable periods.
Figure 3: Top Large Metros for April 2026 Employment Growth Compared to Prior Periods
Real Estate Implications
With low unemployment and little prospects for dramatic cyclical changes, this pattern of moderate to negative employment growth could persist for an extended period. Real estate leasing demand and net operating income (NOI) will be challenged in this environment.
Employment growth is a strongly correlated with real estate performance. Through the business cycle, commercial real estate can continue to achieve positive returns when output falls, but value appreciation requires positive job growth. An employment expansion drives demand for space and the income growth generated from new jobs support rental rate growth.
New jobs increase demand for space across property sectors. Multifamily and other residential rentals gain residents with new jobs and retailers experience higher sales when employment expands. Industrial benefits alongside sales growth as warehouses fill with products for sale and manufacturers assemble products. Although technology has reshaped the demand for office space per worker, office demand still expands on the margin with additional office hires.
This slowdown is not concentrated in certain industries or locations. It is widespread and abrupt policy changes would be required to reverse the trend.
Real estate cycle research has established the importance of payroll employment growth, versus other labor market measures, in gauging the outlook for demand. While supportive of economic output growth, increased productivity is not a driver of leasing demand on its own. Productivity growth becomes a positive for space demand when it increases hiring. Similarly, a low unemployment rate overlooks the importance of additional jobs as a necessary factor for commercial real estate expansion.
The historically low standard deviation in employment growth observed across metros may reduce the ability to generate excess returns from market selection. In prior cycles, investors could outperform by leaning in or out of U.S. regions and/or markets in addition to adjusting their property type allocation. With less variation in this key demand driver, we expect to see the distribution of returns across markets narrow as well.
These employment conditions occurring alongside expense challenges further limit potential NOI growth. Increased insurance costs from climate impacts, building material tariffs, and elevated utility prices will need to be managed against slower property revenue growth.
Conclusion
The prevailing wisdom of markets and media seem relieved that recession may be avoided, but the labor market is experiencing a break from prior cycles. The limits to labor supply from policy shifts and demographics, plus technology-driven changes to labor demand, have consequences for commercial real estate and the broader economy.
The low standard deviation across metropolitan areas show that this is not just a slowdown concentrated in certain industries or locations. The slowdown is widespread and abrupt policy changes would be required to reverse the trend.
Those looking at past recovery patterns in the economy and real estate must not overlook how labor supply and demand have changed, and what it means for real estate demand. While real estate outlooks have focused on whether growth can be sustained amid ‘K-shaped’ spending trends and higher-for-longer interest rates, unless there is intervention to change labor market dynamics, we could see an ‘L-shaped’ real estate recovery.
Flat labor market conditions with less differentiation across metros offer little hope for future value creation as seen in past recoveries, and shifting allocation across metros will not offer the same lift.
About SRR Consulting
Founded by Sara R. Rutledge, CRE® in 2018, SRR Consulting is a research firm serving the commercial real estate industry. SRR Consulting offers clients custom reports and independent insights into investment strategy, macroeconomic conditions, and real estate market outlooks across commercial property types and investment styles.
Ms. Rutledge was previously the head of global market research for StepStone Group, leading the macroeconomic and private equity real estate performance outlooks. She has also served as the managing director of real estate products for a data science start-up, director of research at NCREIF, and a regional director of research at CBRE. Prior to those roles, she spent eight years on Invesco Real Estate’s research team, leading U.S. property market forecasting and global macroeconomic views. Ms. Rutledge has published real estate performance research in Business Economics, co-authored a Real Estate Research Institute-funded paper, and taught research methods as an adjunct professor at her alma mater. She serves on the CRE® Consulting Corps Committee and is an active member of the Urban Land Institute and National Association for Business Economics. Ms. Rutledge earned a Master of Science in Applied Economics and Bachelor of Business Administration at the University of North Texas.
About Southard Advisory and Research
Southard Advisory and Research offers strategic and management consulting by contract for real estate debt and equity investment. We advise on portfolios, individual investments, markets, and capital structuring. Our detailed analyses provide real estate investment and development firms an expert review of their data and analytics strategy and systems; identifying gaps, strengthening methodologies, and formulating approaches for advancement as needed.
Jon Southard has spent his multi‑decade career advancing predictive analytics and applied research in commercial real estate. Most recently, he led a team of researchers and data scientists at Clarion Partners, guiding and validating investment decisions through sophisticated analytics. Previously, Jon served as Principal and Director of Forecasting at CBRE Econometric Advisors, where he delivered data and forecasting solutions to more than 200 of the world’s largest institutional real estate investors.
Jon holds a master’s degree in economics from Brown University and bachelor’s degree from Carleton College. He has authored numerous articles in academic journals and industry publications. He is a Hoyt Fellow and a former Treasurer of the Real Estate Research Institute.
Cheers! Sara ☀️
These are tough times everywhere. Uncertainty (from Trump's tariff war, but also middle east and Russia conflicts), upward pressure on interest rates and cap rates, and a fall in consumer spending post Covid highs are hitting a lot of economies around the world. Low employment growth and layoffs are consistent factors in many economies.
Your evidence from across the US shows how widespread and consistent the challenges are.
If we look back to the 1970s to 1990s, waves of uncertainty and interest rate and inflation volatility also made for employment and income instability. I fear we're back there now.
For IPP real estate: all about keeping a steady income flow. Which means asset and location selection have never been more important, alongside sound operations.